During the last three months, I’ve had the pleasure to work with our team on the Water Point Data Exchange website. We are now introducing many new exciting features to make the sharing and using water point data easier than ever. In the last seven months, visitors have downloaded the complete water point data set twenty times per month or nearly once per work day.
The data was downloaded for many purposes, including planninng, training, and research from a variety of organisations and continents.
Now the new website features make it even easier to use water point data. We appreciate any feedback (see below) you might have on how to make the site even better.
The Data Playground
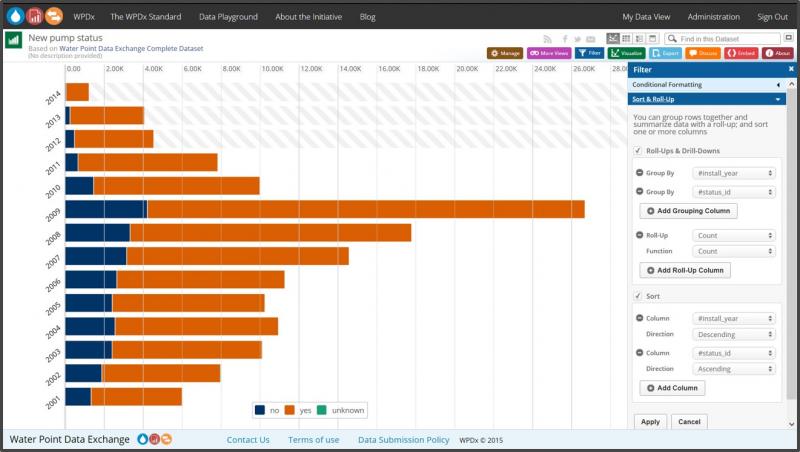
One major addition is the Data Playground, which you can use to visualize water points on maps, charts and save them to your own account.
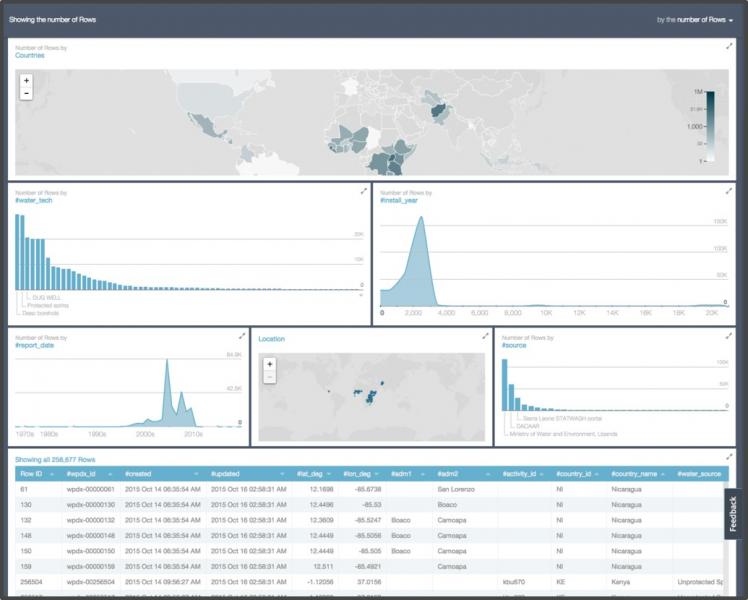
In the Data Playground, the Data Lens provides a global overview of the data and with a click you can filter and compare the global results to the results per country or per organisation.
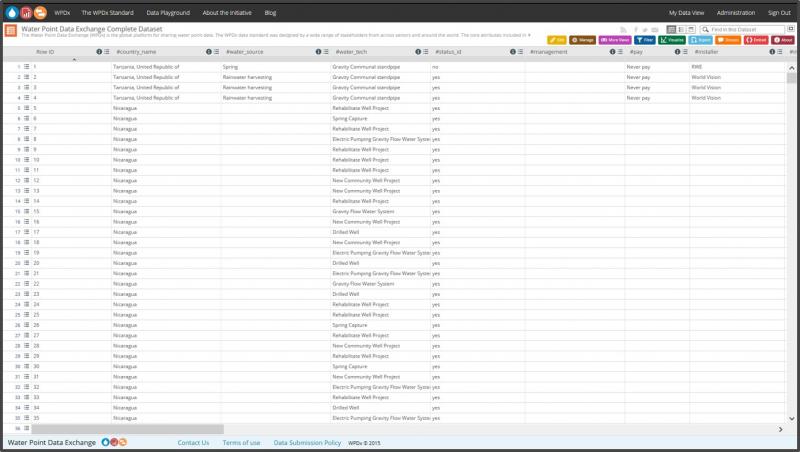
You can also explore the data as a spreadsheet and filter and group information, for example to count the number of water points with flowing water in a particular country. These straightforward functions allow you to create and share charts, graphs and maps.
You can also download the raw data and then use it in a spreadsheet program such as MS Excel or OpenOffice Calc. Software developers can also use the advanced API functions to ensure that the latest water point data is also available in your other websites and apps.
Notifications
If you want to follow new water point data uploads on a granular level, you can sign up for notifications. Notifications will send you emails when you select countries and organisations to follow. By using notifications, you will also receive a link to the the individual water point data set.
Uploading data
Organisations, users and apps with water point data to share with a wider audience, can use our website to upload and share the datasets. These datasets will be available in the Data Playground and any linked third party websites and apps that use WPDx data.
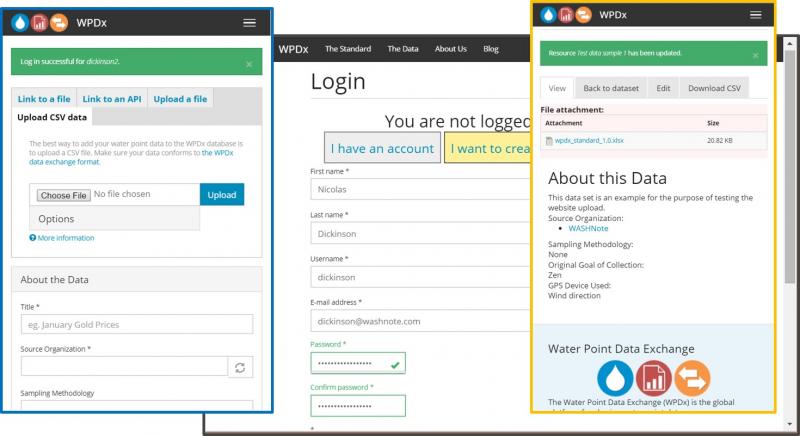
To upload data, you can follow our instruction on how to prepare your data in the menu under “The Standard”. When it is uploaded, it will be reviewed by the WPDx administrator and if there are any issues, we’ll help you resolve them before the data is published. Within 24 hours after publication, the data should be available in the Data Playground.
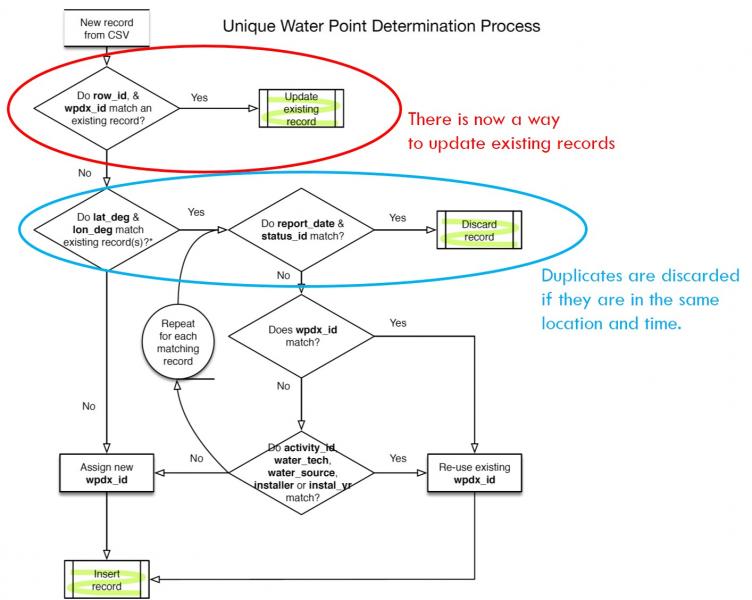
The website has a unique water point identification function to reduce duplicate water points and identify updates about the same water point.
Akvo and mWater are part of the Water Point Data Exchange Working Group and are helping us think about how to make it easier for the users of tools to publish to WPDx and visualize these data sources together and they have taken a number of steps to enable users to think about the standard while they are designing their data collection formats.
Feedback
Please let us know what you think about the new website by either leaving a comment on this blog and help us spread the word in social media. If you have a feature request or an issue to report, help us address the issue by kindly filling out the website issue form.
Acknowledgements
I would like to extend a special thanks to the Water Point Data Exchange team that have helped to put the website and content together. This includes Brian Banks from GWC who help inspire and drive WPDx from the beginning, Tori Phillips from GWC, Eric Johnson and his team at El Studio, and Valerie Shephard and Monika Shepard and the team at Socrata.